energy_analysis_toolbox.load_profiles.rolling_profile module#
The module defines rolling aggregations from history.
The two following sections explain the main steps of the computations :
the Pivot phase
the Rolling phase
1. The Pivot Phase#
The first step is to aggregates the different days of the history align by time.
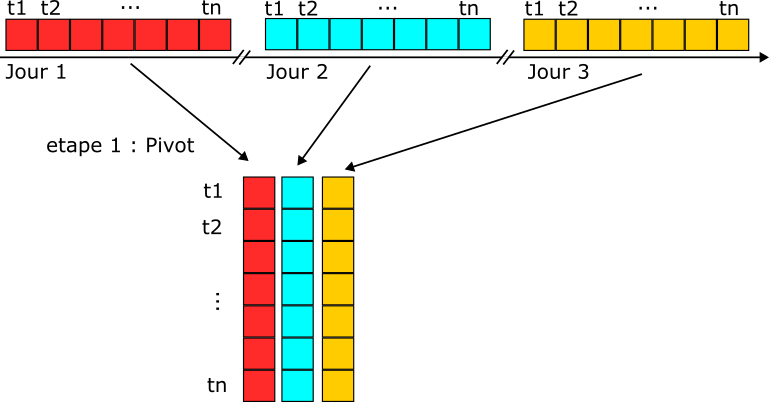
To do this step, we need the timestamps to be aligned. For instance, the time should be rounded to the minute, as trailing microseconds could impact the pivot.
2. The Rolling agg Phase#
The second step is to convert the 2D array into a 1D array with a rolling window aggregation.
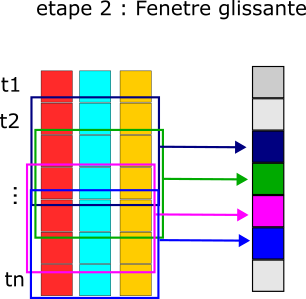
In contrast with most rolling window implementations, here the window rolls along the time-of-day (wall clock time), but not along the days: all the history data which time-of-day falls within the window around the target time-of-day is included in the aggregation. E.g., with a 60min centered window, the data at time t in the returned profile is the aggregation of all the data in history which time-of-day is 30min before or after t, whatever the date.
The window size is a duration (like 60min), that can manage
missing data via pandas.
Note
This look-up using pandas slices is significantly slow.
A solution to improve the performance of the rolling profile is to make sure that all the expected rows are present (filled with NaNs if necessary).
Using this pre-formatting step, we can use numpy to slice
using row indexes.
- class energy_analysis_toolbox.timeseries.profiles.rolling_profile.RollingProfile(window: int | str | Timedelta, aggregation: Callable[[ndarray], float], as_mean_offset: bool | None = None, offset_factor: float = 1.0, column_name: str | int = 'value')[source]#
Bases:
objectCompute a profile by aggregating the history on time-periods rolling windows.
- compute(history: DataFrame, time: Timestamp, **kwargs) Series[source]#
Compute the rolling aggregation profile.
- Parameters:
history (pd.DataFrame) – The timeseries of history data, with at least a
self.column_namecolumn containing the values to be used to create the profile. The data should be sampled homogeneously, such that measures are repeated at the same time-of-day for every day in the history.time (pd.Timestamp) – The time at which the computed profile should start.
- Returns:
pd.Series – The computed profile, with same sampling as the history.
- daily_pivot(history: DataFrame) DataFrame[source]#
Transform history data into a table with time-of-day rows and date columns.
This function reshapes the historical timeseries data into a pivoted format where each column represents a day, and each row corresponds to a specific time-of-day. This allows for time-of-day-based aggregations over multiple days.
- Parameters:
history (pd.DataFrame) – A DataFrame containing the history data, with a DateTimeIndex. It must include the column specified by
self.column_name, which represents the values to be processed.- Returns:
pd.DataFrame – A pivoted DataFrame where: - Each column corresponds to a specific day from the history. - Each row represents a specific time-of-day. - Values are from the column specified by
self.column_name.
Notes
- This function handles Daylight Saving Time (DST) changes. Specifically:
For winter DST transitions (25-hour days), any times beyond 24 hours (e.g., the last hour of the day) are dropped to ensure consistency.
Duplicated timestamps due to DST transitions are resolved by keeping the first occurrence.
Times should be rounded to a consistent resolution (e.g., seconds or minutes) to avoid pivoting errors due to small differences in time values.
Warning
Winter DST creates days lasting 25h, which would lead to 25h profiles. This function drops any moment in the day which is more than 24h after midnight this day, i.e. drops the last hour of the DST. This is not perfect but this is considered satisfactory to begin with.
- windowed_rolling_agg(pivoted_history: DataFrame) DataFrame[source]#
Return rolling aggregation over date/time-of-day-window in a pivoted history.
- Parameters:
pivoted_history (pd.DataFrame) – The multi column dataframe on which to compute the aggregation. The dataframe columns are series of values (usually a date for each column) and the rows are times which can be rolled by a duration window.
- Returns:
aggregated (pd.Dataframe) – The computed aggregation as a table with one column named
self.column_name.
Note
Using the setup allows to be sure that the dataframe
pivoted_historyupon which the agg is computed is the desired one (local scope ofcustom_agginstead of global scope).
- class energy_analysis_toolbox.timeseries.profiles.rolling_profile.RollingQuantileProfile(window: int | str | Timedelta, threshold_quantile: float, as_mean_offset: bool | None = None, offset_factor: float = 1.0, column_name: str | int = 'value')[source]#
Bases:
RollingProfileA profile computed by a Quantile of the history on rolling windows.